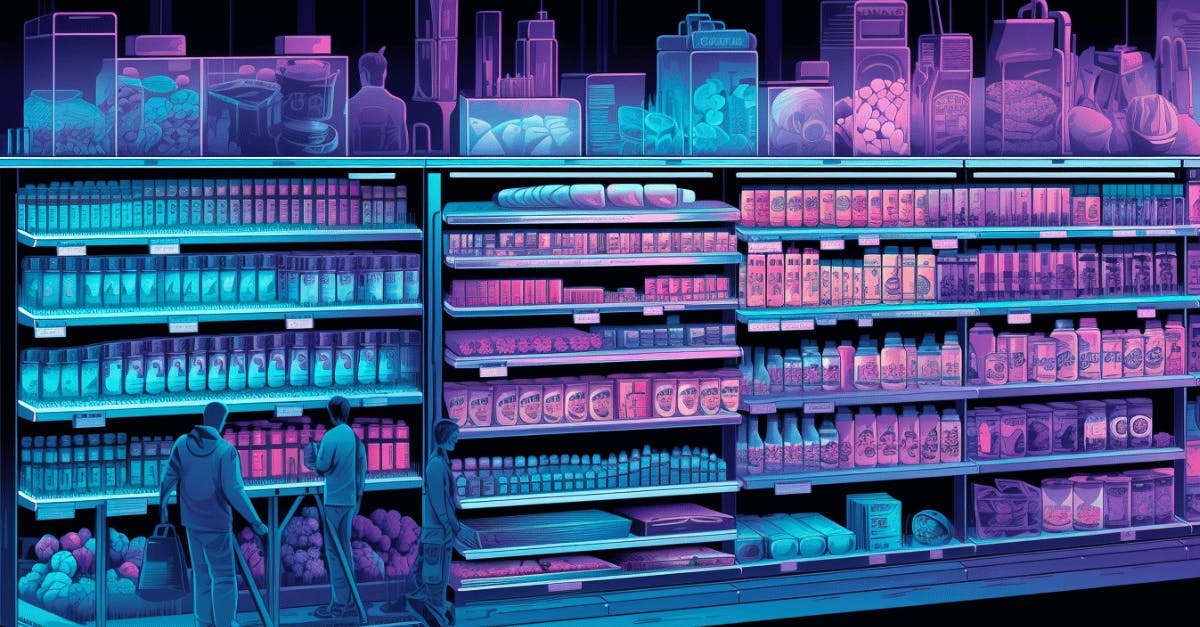
The Evolution of Planogram Efficiency: Adapting to the Dynamic Retail Landscape
The evolution of planogram efficiency reflects a broader trend in the retail industry: the need to adapt to a dynamic landscape where consumer preferences, technological advancements, and market conditions are in constant flux. Further, the process of planogram creation, even when hyper-local, can be inefficient and costly. Teams often develop 'averages of averages' approaches and strategies, including larger cluster sizes, exacerbating the challenge and leading to overstocking in some stores and understocking in others. In this article, we'll explore the recent developments in planogram efficiency and how retailers can stay ahead in this changing environment.
Understanding the Modern Planogram
Traditionally, planograms were static, created solely to maximize shelf space and align with merchandising strategies. Today, they are dynamic tools integral to retail success. Modern planograms are data-driven, often created using sophisticated software that analyzes sales data and other market insights. This data-centric approach enables more accurate predictions of consumer behavior and preferences. However, due to the complexity of preparing planograms, such as considering the specific needs of store shoppers and merchandise rules, even modern planogram software has its limitations.
Adapting to Consumer Needs
A significant shift in planogram efficiency is the move toward hyper-local or store-specific planograms. Advances in machine learning models, which learn from planogram files like PSA, incorporate embedded merchandise rules, merchandising flows, and store-level sales data to meet the needs of store shoppers. This hyper-localization ensures that each store carries products that resonate with its specific customer base, thereby increasing sales and customer satisfaction.
Leveraging Technology
Advancements in technology, particularly in AI and machine learning, have revolutionized planogram design and automation processes. Tools like HIVERY Curate harness store-level data to provide retailers with deep insights into optimal product placement and translate it into planograms or "modules". By analyzing vast amounts of data, these tools can predict the impact of each product’s placement and merchandise flow, allowing retailers to make informed decisions quickly.
Balancing Art and Science
While data is crucial, the art of merchandising still plays a vital role. The most effective planograms balance data-driven insights with the human touch – understanding the aesthetic appeal of product placement and the overall shopping experience. This balance ensures that stores are efficient, engaging, and shopper-friendly.
Unlike traditional methods that rely on spreadsheets and data tables, modern retail planning tools allow interaction with visual insights directly on the planogram. This visual and interactive approach enables decision-makers to see and manipulate how different assortment strategies play out in real-world scenarios.
For example, by simulating the addition or deletion of products in the assortment plan, stakeholders can not only see how decisions will impact days of supply (DOS), core brand priorities, and overall store performance but also observe the impact of demand transference and incrementality at the store level. This interactive visualization removes the guesswork and provides rapid insights, enabling more intuitive and informed decisions.
Responding to E-commerce Trends
The rise of e-commerce has forced brick-and-mortar retailers to reconsider their in-store strategies. Efficient planogramming now involves creating synergy between online and offline experiences. For instance, stores might prioritize popular products or use planograms to enhance in-store pickup experiences for online shoppers.
The Role of Real-Time Data
The adoption of real-time data feeds into planogram software marks a significant evolution. Retailers can adjust layouts more quickly in response to real-time sales data, sudden market trends, or inventory changes. This agility is critical in staying relevant and competitive. For example, you can ask questions below and quantify them in volume, sales, or profit. With Curate, you can see the metrics change as you run different strategy simulations and, once satisfied with the strategy, export the PSA for execution.
The evolution of planogram efficiency is a testament to the retail industry's adaptability and its continuous strive for improvement. By leveraging technology, data, and human insights, retailers can create store layouts that meet current market demands and anticipate future trends. In this dynamic landscape, the retailers who will thrive view planograms not just as a merchandising tool but as a strategic asset in their quest to deliver the best shopping experience.
Related content you might be interested in:
- AI-Driven Planogram Management: HIVERY Curate's Impact on a Multinational Grocer's 500,000+ Planograms
- Edge Assortment Strategy: From innovation to different pack sizes
- Customer Story - Boosting Revenue by $32M: Uncovering Store-Level Shopper Habits
- How To Get Assortment Space Contribution Index Optimized